DATA DRIVEN SPORT HUB
Sport hub for analysis, scientific research and technology for the evaluation of human performance.

UNLOCK YOUR POTENTIAL
Are you ready? Count on us to revolutionize your company's online identity.
About us
Our Data Driven Performance Lab, based in Milan, is LWT3's cutting-edge facility for data acquisition, analysis, and insight. We empower Federations, Teams, Companies, Coaches, and elite Athletes to optimize performance.
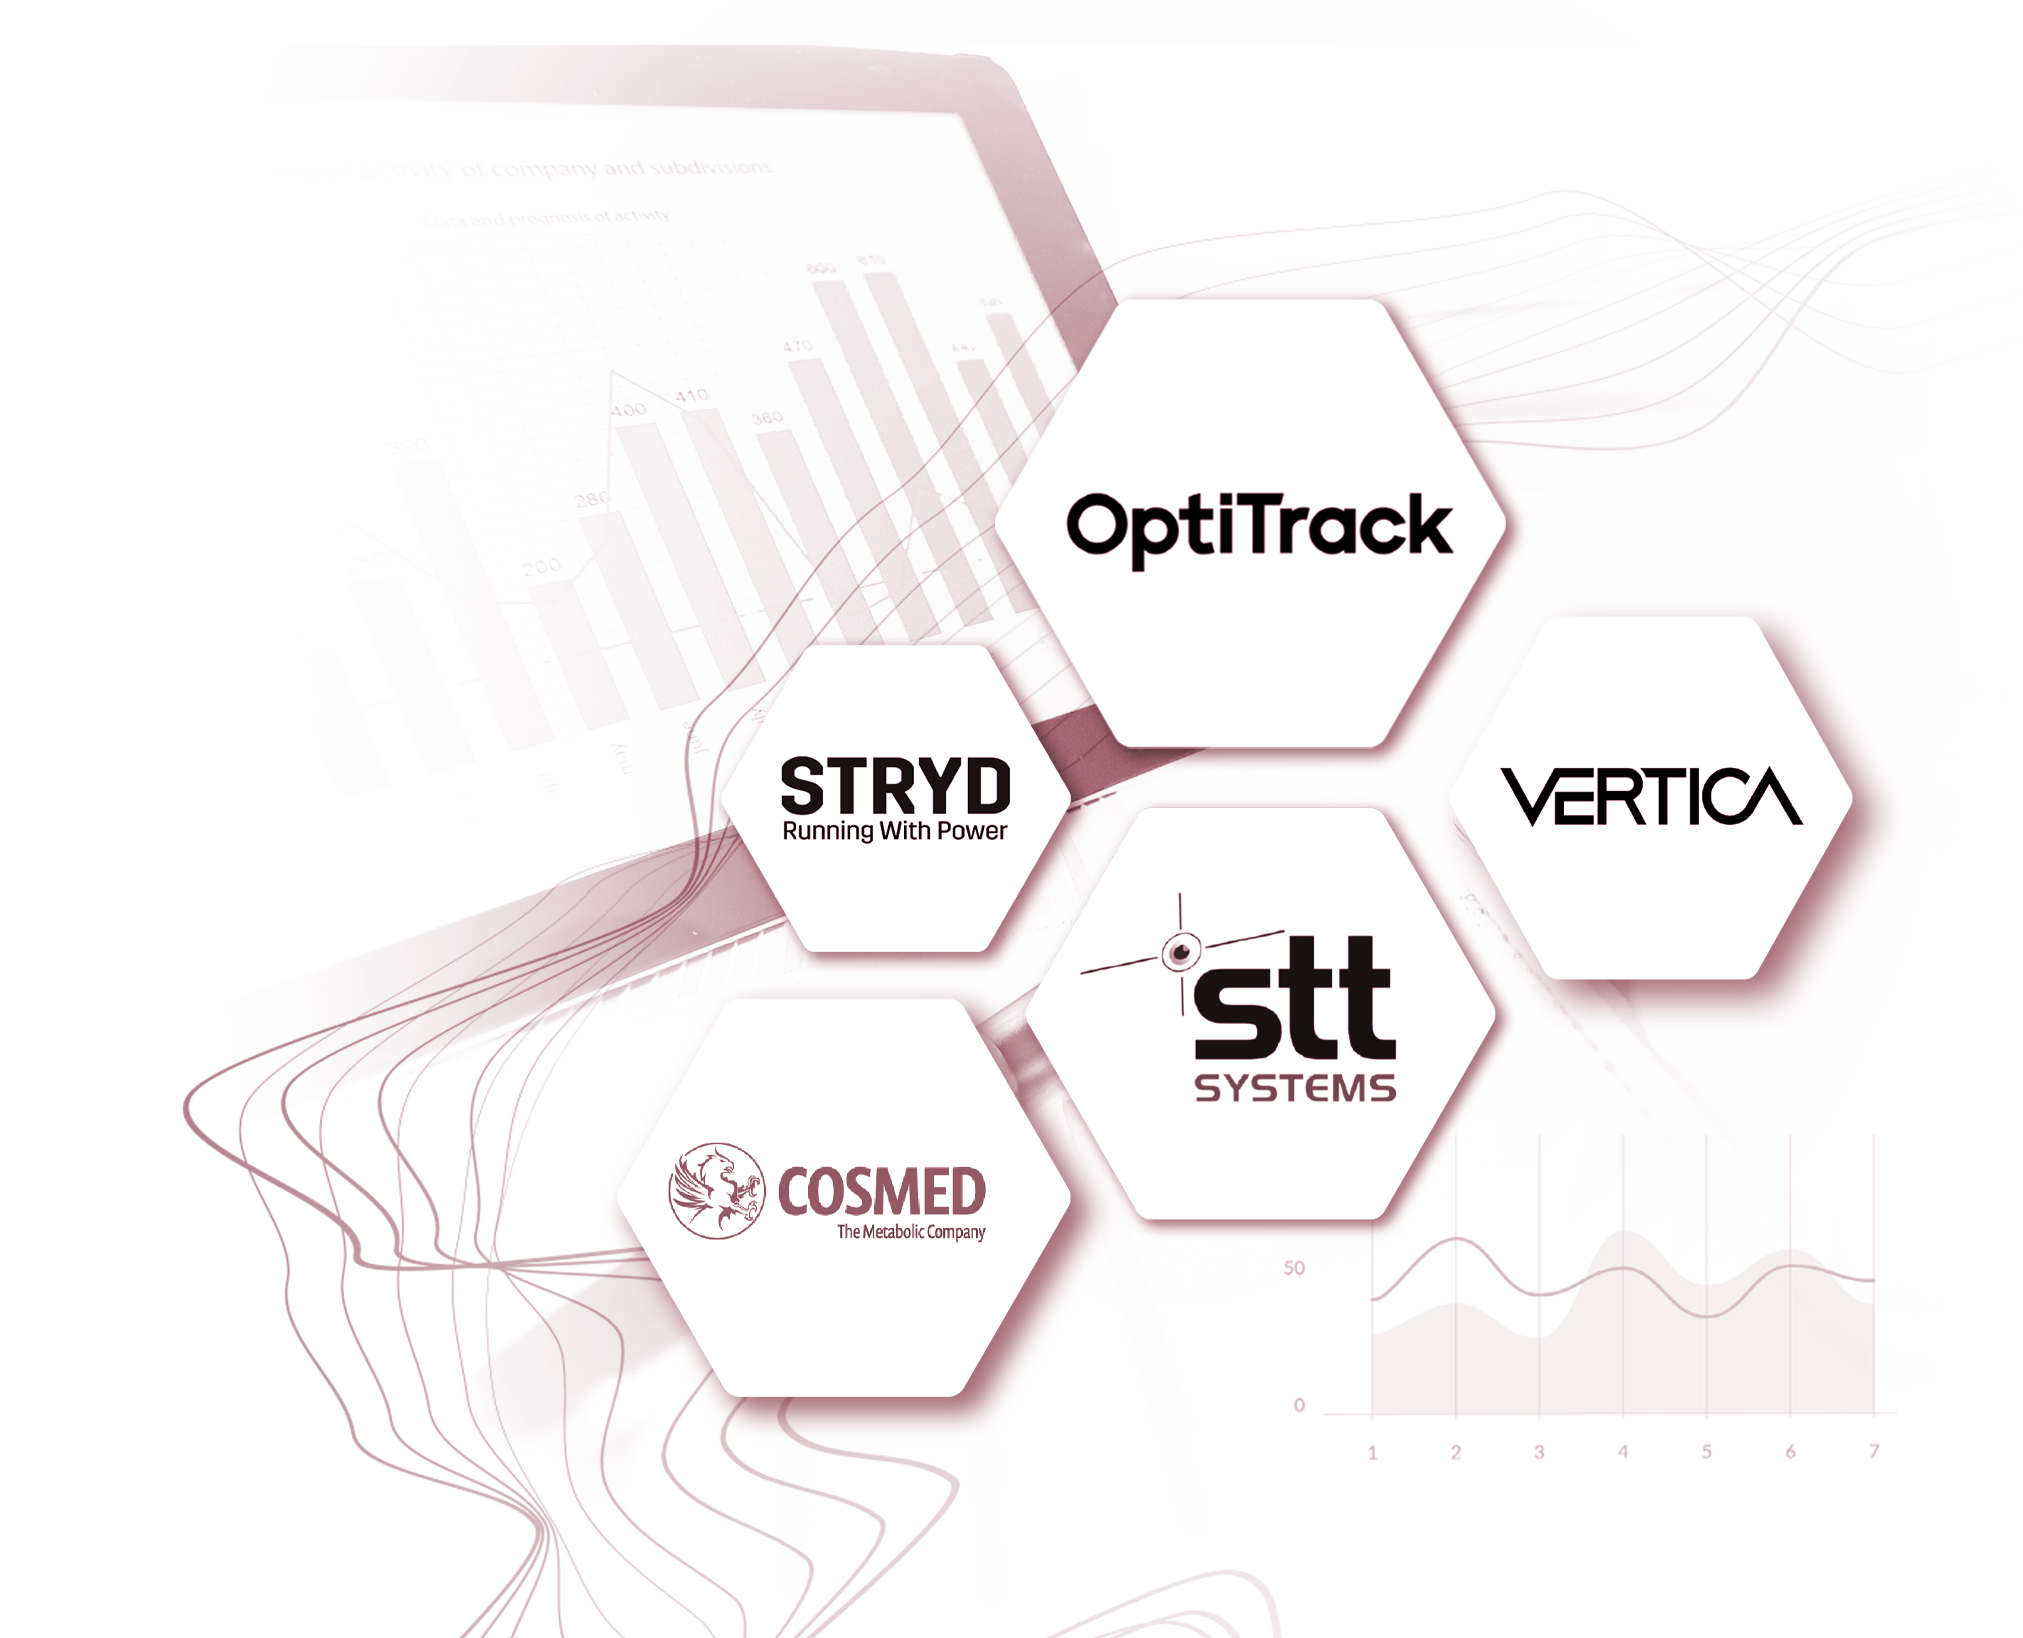
Our multidisciplinary team of Engineers, Physiologists, Coaches, Data Scientists, and UX/UI Experts leverages state-of-the-art equipment and custom-developed software to operate both on-site and remotely.
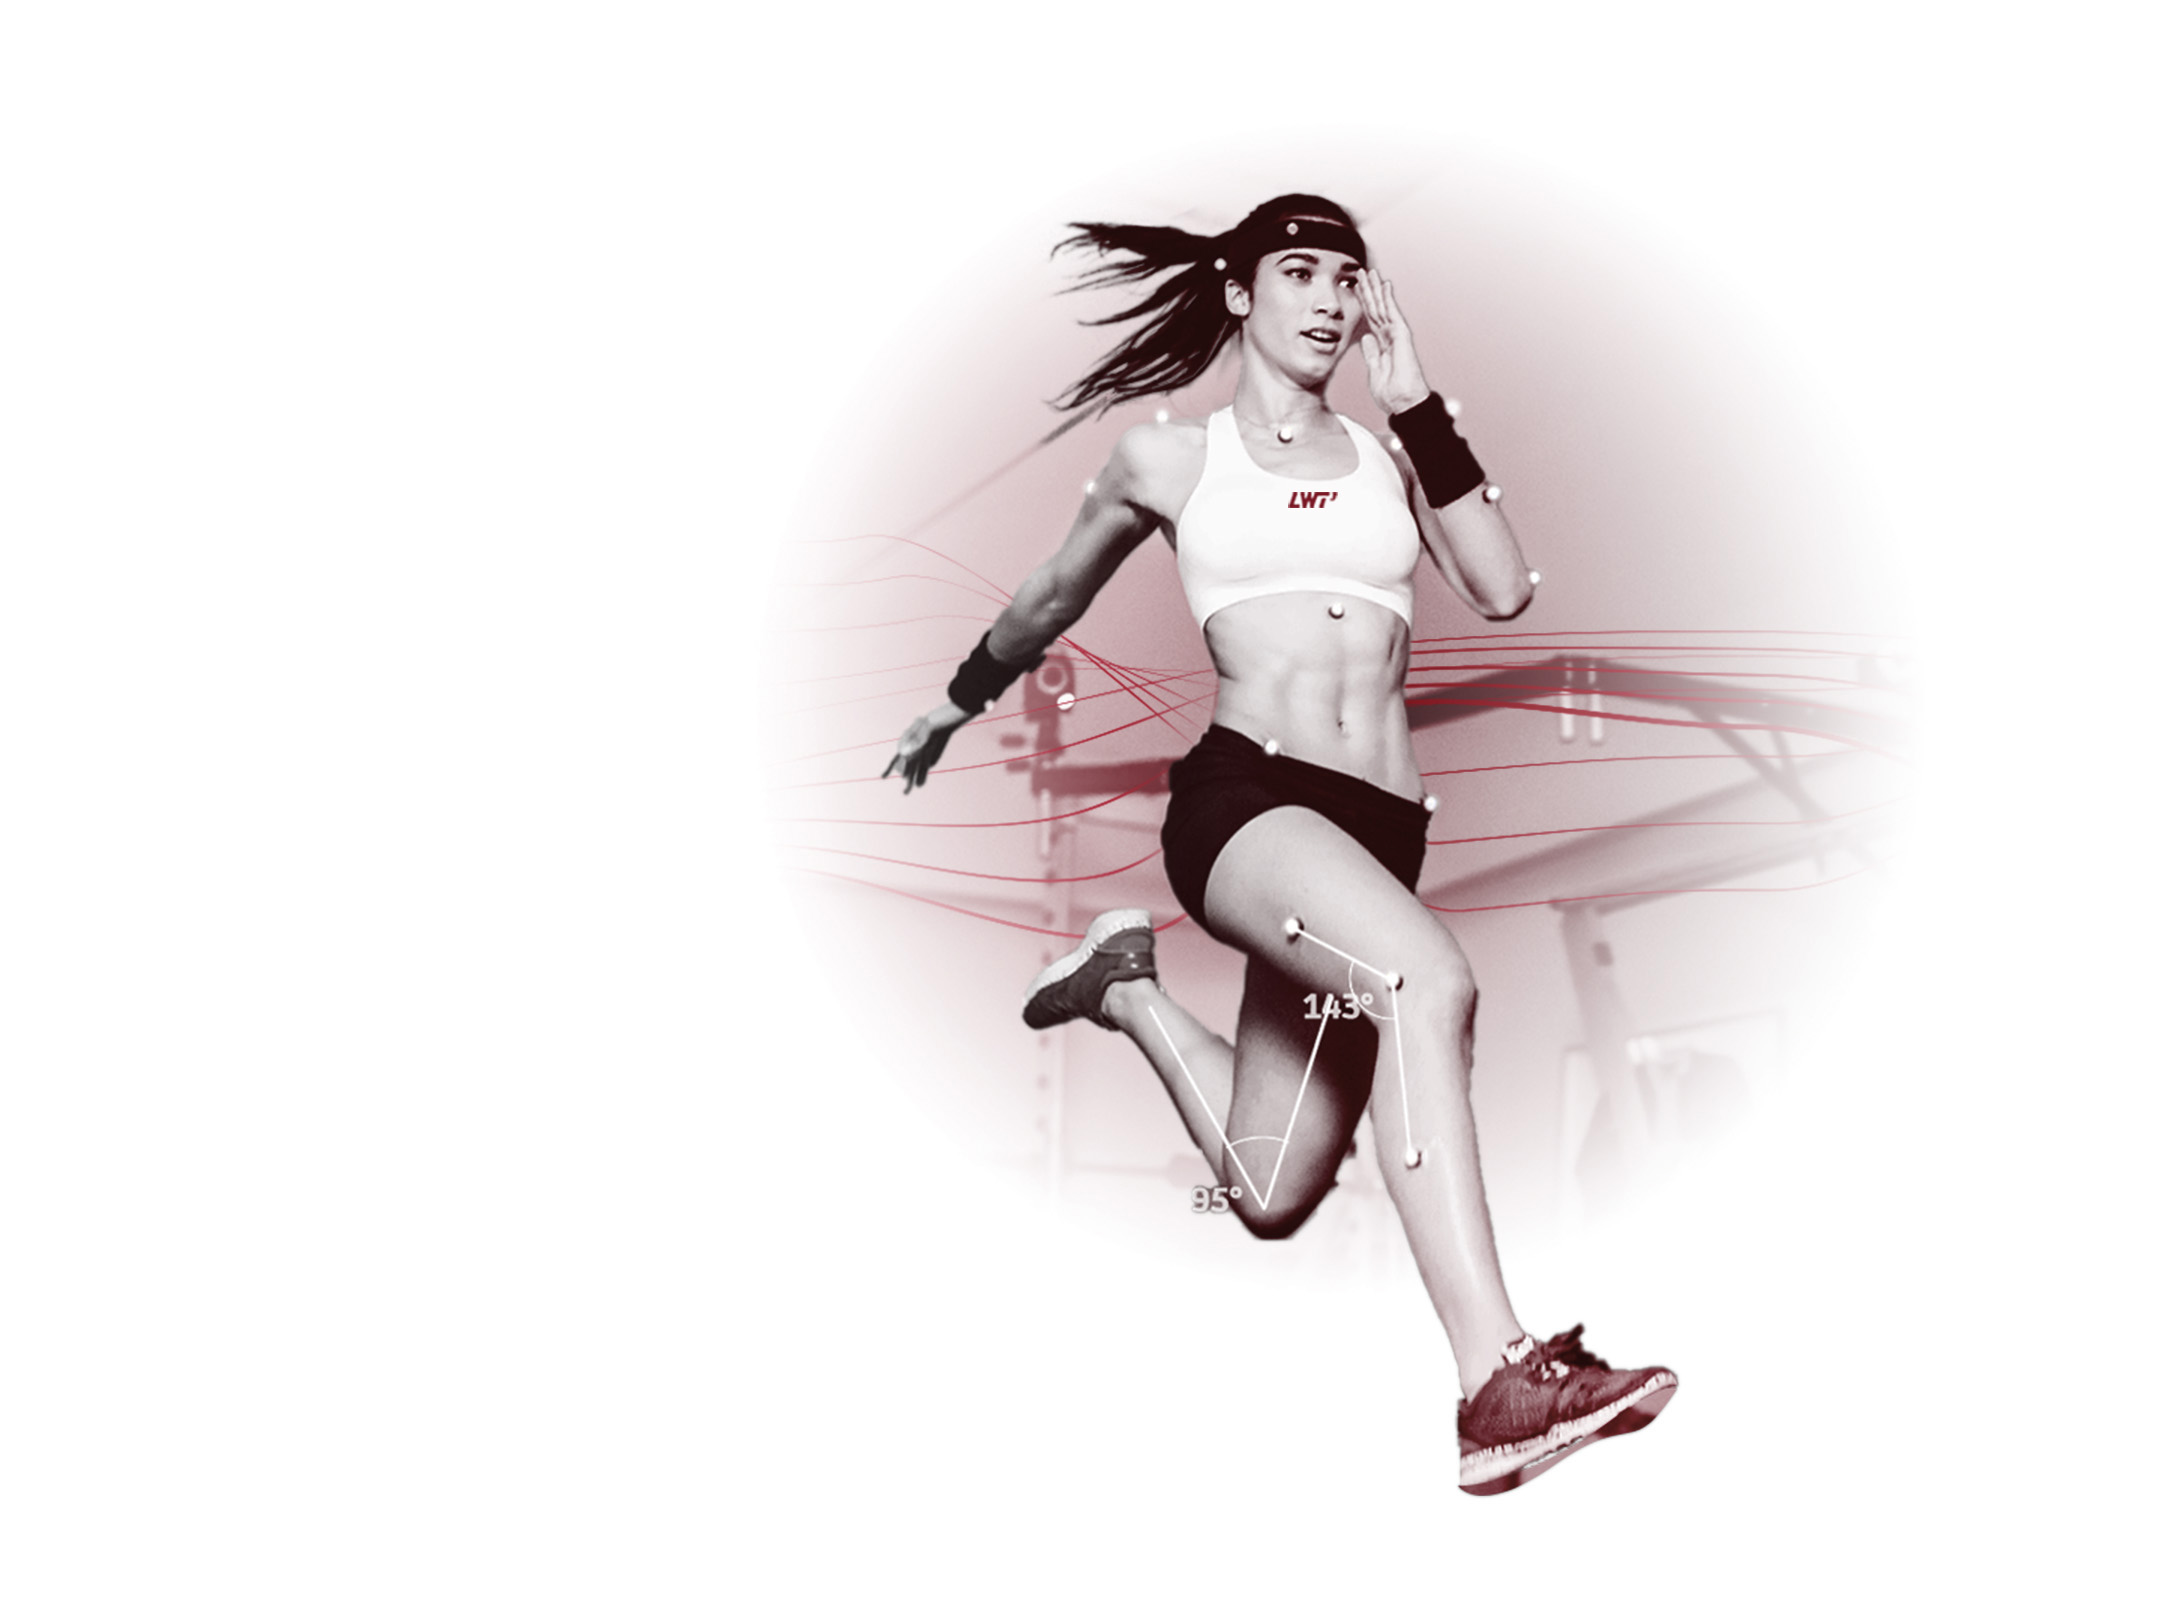
We support athletes and coaches in decision-making, identifying performance-limiting factors and cause-and-effect relationships in training stimuli. Our portable equipment adapts to diverse disciplines, while our skilled staff swiftly transforms data into actionable insights for coaches.
LWT3 is an innovative company with expertise in data acquisition, management, analysis, and performance understanding.
What We Do
Services
Focused on results we seek to raise the level of our customers.
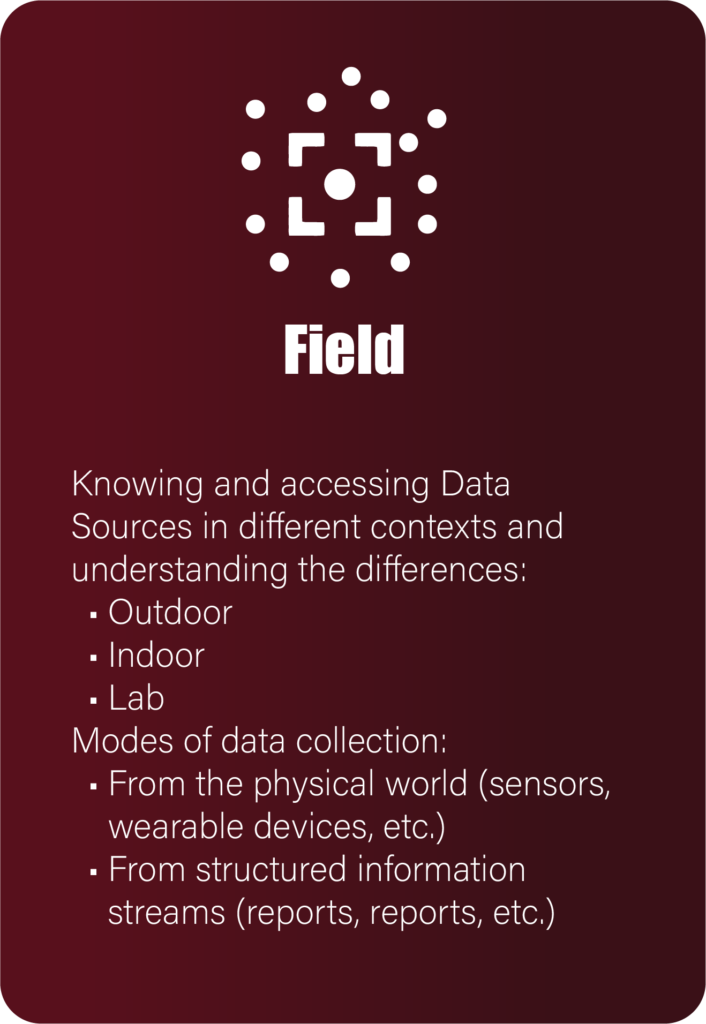
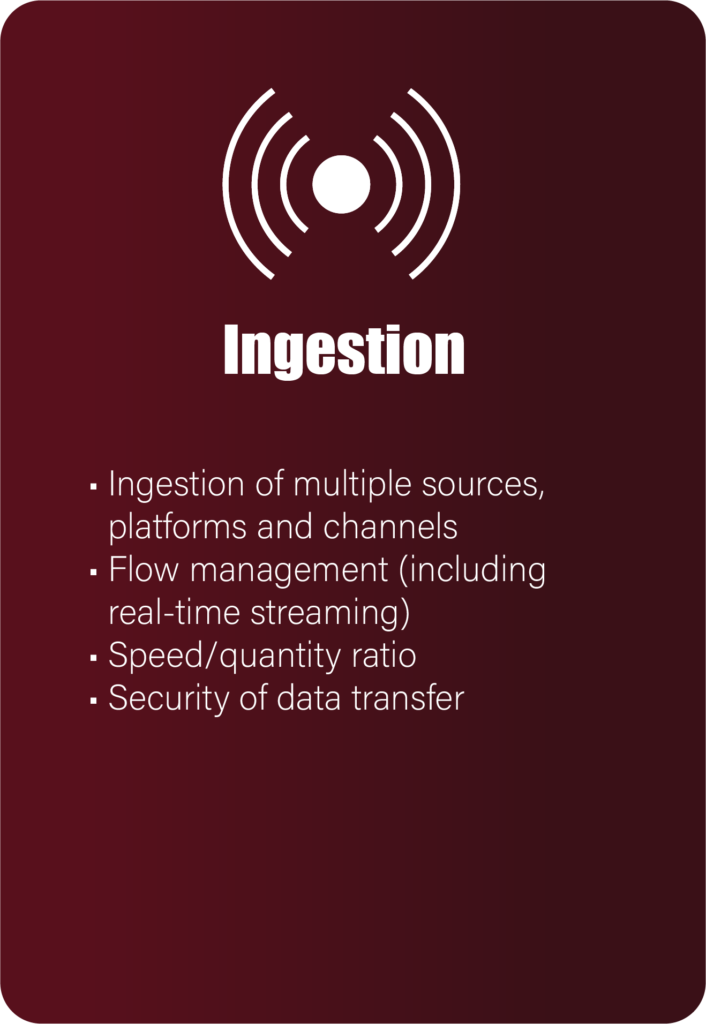
Data Driven Pipeline
FAQ
For more technical information, please refer to our frequently asked questions.
WHERE IS THE ANALYSIS CONDUCTED AT LWT3?
The analysis takes place in our Labs located in Milan, though we are open to relocating upon request from our headquarters.
WHO IS THE LWT3 ANALYSIS TARGETED TOWARDS?
- Enterprise Services: We specialize in data acquisition and analysis of materials and products for companies within the sports industry. This aids in supporting their research and development as well as testing phases.
- Teams and Sports Clubs: We manage the acquisition and analysis of data for large and diverse sports teams..
- Wellness Corporate Program: We offer sports practices tailored to organizations and align business and sports evaluation KPIs through data fusion techniques. .
- Sports Federations: We conduct data acquisition and analysis for various sports disciplines in collaboration with coaches and technicians. Additionally, we provide support for physical recovery, assisting coaches and specialists in delivering valuable data for injury recovery.
WHY IS LWT3 ANALYSIS USEFUL?
LWT3 oversees end-to-end processes, products, and services rooted in data analysis. We place great emphasis on data mining from the field and understanding the generated information, all in pursuit of enhancing your performance in action.